
The Power of Effective Data Visualization
The Power of Effective Data Visualization
What insights are you actually drawing from your manufacturing data?
Many manufacturers have invested heavily in systems that collect production data, but collecting data is only the first step. If operators and supervisors can’t quickly understand what the data is telling them, valuable information goes unused and opportunities to improve performance are missed.
Effective data visualization transforms raw operational data into clear, actionable insights, enabling faster decisions, improved troubleshooting, and greater confidence across the plant floor.
The Challenge
This client had an existing MES system that successfully captured large volumes of production data. However, the system lacked usability and clarity.
Operators and supervisors struggled to interpret the data due to excessive navigation and poor interface design. As a result:
- Data was difficult to access and understand
- Trust in the system declined
- Troubleshooting production issues became inefficient
The client lacked visibility into key performance drivers such as downtime, speed loss, and overall equipment effectiveness (OEE). Despite having the data, they could not confidently answer basic operational questions or identify trends.
The Solution
Actemium Avanceon partnered with the client to better understand how their teams needed to use the data in real-world scenarios.
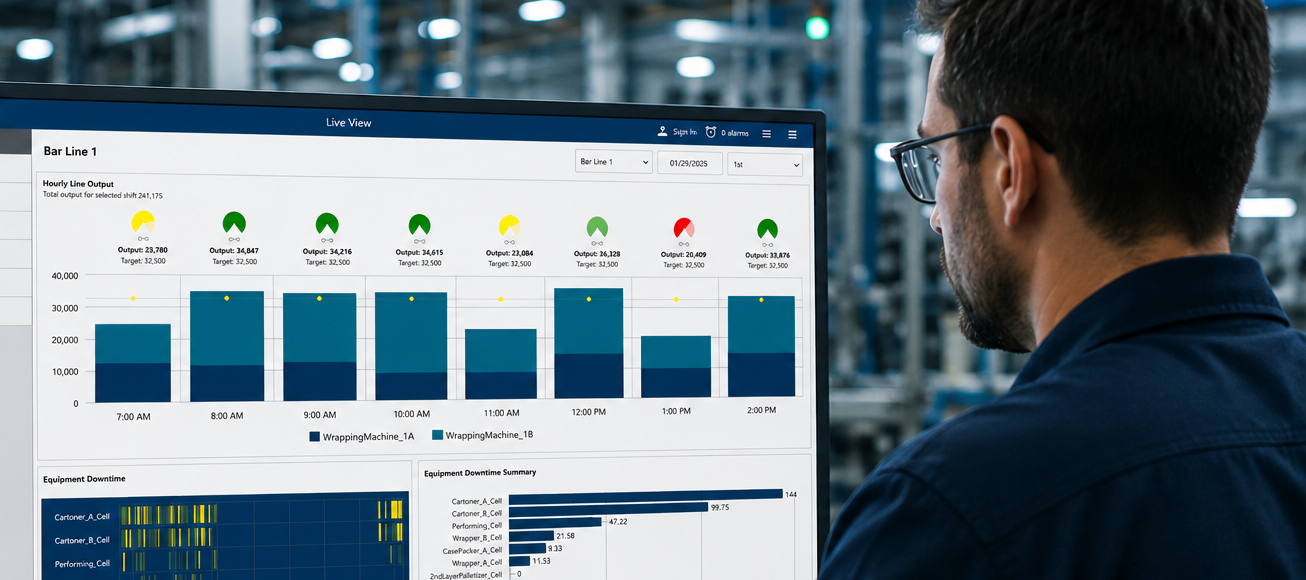
Through collaborative workshops, we defined key use cases and designed an intuitive, user-focused dashboard that required minimal interaction.
The solution included:
- A default view of the current day’s active shift
- Line-level visibility with the ability to drill down as needed
- Clear differentiation between “good” and “bad” production hours
- Immediate identification of equipment experiencing unplanned downtime
- Shift-level summaries of downtime across all equipment
Importantly, this was a visualization-only solution. No changes were made to the client’s underlying data.
The Team
The project was led by a Senior Engineer, who evaluated the existing MES system, identified critical data points, and developed a scalable dashboard solution.
The initial deployment covered two pilot lines, with the architecture designed to scale across additional lines and equipment.
The Results
Before project closeout, the client was already realizing value.
Using the new dashboard, they were able to quickly identify two pieces of equipment requiring operator attention and take corrective action immediately.
Key outcomes included:
- Improved visibility into production performance
- Faster identification of downtime and inefficiencies
- Increased confidence in operational data
- A scalable foundation for future expansion
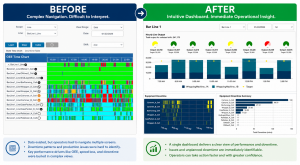
Actemium Avanceon transformed the client’s existing data into actionable insight through effective visualization.
This project highlights a critical truth: data alone is not enough. Without clear visibility and intuitive presentation, valuable information remains underutilized.
By delivering a user-friendly dashboard, Actemium Avanceon enabled the client to better understand their operations, respond faster to issues, and make more informed decisions.
Your Data Has the Answers. Can Your Team See Them?
Transform your existing production data into clear, actionable insights with intuitive dashboards designed around the way your operators work.
Contact us to learn how we can help improve visibility, reduce downtime, and support better operational decisions.
Written by: Courtney Smith